Croissance Tutorial#
Examples taken from unit tests of the package.
import numpy as np
import pandas as pd

import croissance
from croissance import plot_processed_curve, process_curve

croissance.__version__

yscale = "both"  # 'linear', 'log', 'both'
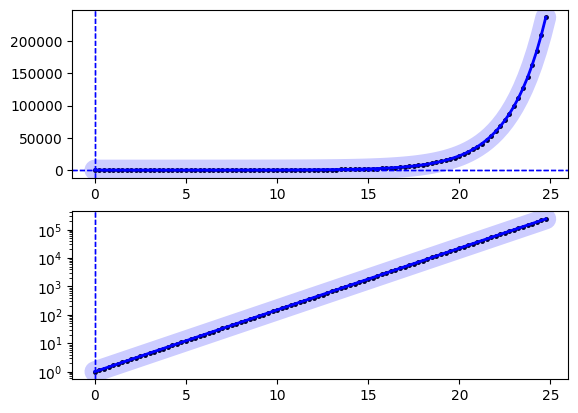
mu = 0.5
pph = 4.0
curve = pd.Series(
    data=[np.exp(mu * i / pph) for i in range(100)],
    index=[i / pph for i in range(100)],
)

result = croissance.process_curve(curve, constrain_n0=True, n0=0.0)
plot_processed_curve(result, yscale=yscale)
result
/home/docs/checkouts/readthedocs.org/user_builds/croissance/envs/latest/lib/python3.13/site-packages/croissance/estimation/smoothing/segments.py:19: FutureWarning: The behavior of obj[i:j] with a float-dtype index is deprecated. In a future version, this will be treated as positional instead of label-based. For label-based slicing, use obj.loc[i:j] instead
  window = series[i : i + size * increment]
/home/docs/checkouts/readthedocs.org/user_builds/croissance/envs/latest/lib/python3.13/site-packages/croissance/estimation/smoothing/segments.py:60: FutureWarning: The behavior of obj[i:j] with a float-dtype index is deprecated. In a future version, this will be treated as positional instead of label-based. For label-based slicing, use obj.loc[i:j] instead
  window = series[start:end]
AnnotatedGrowthCurve(series=0.00          1.000000
0.25          1.133148
0.50          1.284025
0.75          1.454991
1.00          1.648721
             ...
23.75    143630.599308
24.00    162754.791419
24.25    184425.340126
24.50    208981.288870
24.75    236806.824203
Length: 100, dtype: float64, outliers=Series([], dtype: float64), growth_phases=[GrowthPhase(start=0.0, end=24.75, slope=np.float64(0.49999999999999944), intercept=np.float64(-1.0214051826551478e-14), n0=0.0, SNR=np.float64(1.3675494859083384e+28), rank=np.float64(100.0))])

result = process_curve(curve, constrain_n0=False)
plot_processed_curve(result, yscale=yscale)
result
AnnotatedGrowthCurve(series=0.00          1.000000
0.25          1.133148
0.50          1.284025
0.75          1.454991
1.00          1.648721
             ...
23.75    143630.599308
24.00    162754.791419
24.25    184425.340126
24.50    208981.288870
24.75    236806.824203
Length: 100, dtype: float64, outliers=Series([], dtype: float64), growth_phases=[GrowthPhase(start=0.0, end=24.75, slope=np.float64(0.5), intercept=np.float64(-4.440892098500626e-16), n0=np.float64(3.3579845166727114e-13), SNR=np.float64(1.9111880576223483e+31), rank=np.float64(100.0))])
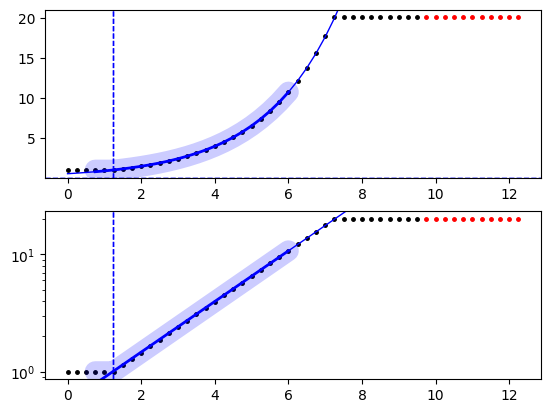
mu = 0.5
pph = 4.0

curve = pd.Series(
    data=(
        [1.0] * 5
        + [np.exp(mu * i / pph) for i in range(25)]
        + [np.exp(mu * 24 / pph)] * 20
    ),
    index=([i / pph for i in range(50)]),
)

result = process_curve(curve, constrain_n0=True, n0=0.0)
plot_processed_curve(result, yscale=yscale)
result
AnnotatedGrowthCurve(series=0.00     1.000000
0.25     1.000000
0.50     1.000000
0.75     1.000000
1.00     1.000000
1.25     1.000000
1.50     1.133148
1.75     1.284025
2.00     1.454991
2.25     1.648721
2.50     1.868246
2.75     2.117000
3.00     2.398875
3.25     2.718282
3.50     3.080217
3.75     3.490343
4.00     3.955077
4.25     4.481689
4.50     5.078419
4.75     5.754603
5.00     6.520819
5.25     7.389056
5.50     8.372897
5.75     9.487736
6.00    10.751013
6.25    12.182494
6.50    13.804574
6.75    15.642632
7.00    17.725424
7.25    20.085537
7.50    20.085537
7.75    20.085537
8.00    20.085537
8.25    20.085537
8.50    20.085537
8.75    20.085537
9.00    20.085537
9.25    20.085537
9.50    20.085537
dtype: float64, outliers=9.75     20.085537
10.00    20.085537
10.25    20.085537
10.50    20.085537
10.75    20.085537
11.00    20.085537
11.25    20.085537
11.50    20.085537
11.75    20.085537
12.00    20.085537
12.25    20.085537
dtype: float64, growth_phases=[GrowthPhase(start=0.75, end=6.0, slope=np.float64(0.49736914365040924), intercept=np.float64(1.2283513350955648), n0=0.0, SNR=np.float64(3181.8035724440265), rank=np.float64(100.0))])
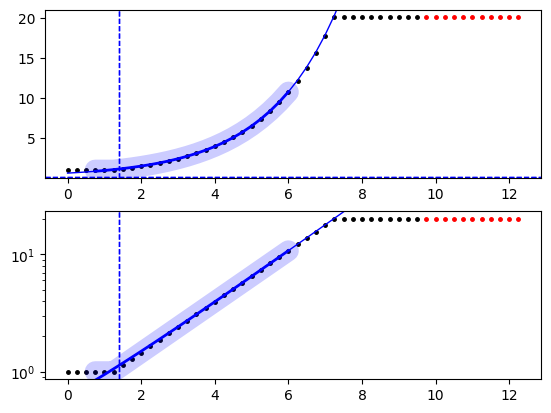
result = process_curve(curve, constrain_n0=False)
plot_processed_curve(result, yscale=yscale)
result
AnnotatedGrowthCurve(series=0.00     1.000000
0.25     1.000000
0.50     1.000000
0.75     1.000000
1.00     1.000000
1.25     1.000000
1.50     1.133148
1.75     1.284025
2.00     1.454991
2.25     1.648721
2.50     1.868246
2.75     2.117000
3.00     2.398875
3.25     2.718282
3.50     3.080217
3.75     3.490343
4.00     3.955077
4.25     4.481689
4.50     5.078419
4.75     5.754603
5.00     6.520819
5.25     7.389056
5.50     8.372897
5.75     9.487736
6.00    10.751013
6.25    12.182494
6.50    13.804574
6.75    15.642632
7.00    17.725424
7.25    20.085537
7.50    20.085537
7.75    20.085537
8.00    20.085537
8.25    20.085537
8.50    20.085537
8.75    20.085537
9.00    20.085537
9.25    20.085537
9.50    20.085537
dtype: float64, outliers=9.75     20.085537
10.00    20.085537
10.25    20.085537
10.50    20.085537
10.75    20.085537
11.00    20.085537
11.25    20.085537
11.50    20.085537
11.75    20.085537
12.00    20.085537
12.25    20.085537
dtype: float64, growth_phases=[GrowthPhase(start=0.75, end=6.0, slope=np.float64(0.5127128764867714), intercept=np.float64(1.3854731755754246), n0=np.float64(0.12297736348508152), SNR=np.float64(4525.5963549565195), rank=np.float64(100.0))])
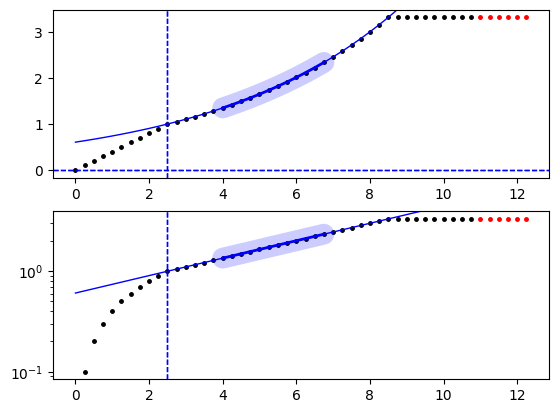
mu = 0.20
pph = 4.0

curve = pd.Series(
    data=(
        [i / 10.0 for i in range(10)]
        + [np.exp(mu * i / pph) for i in range(25)]
        + [np.exp(mu * 24 / pph)] * 15
    ),
    index=([i / pph for i in range(50)]),
)
result = process_curve(curve, constrain_n0=True, n0=0.0)
plot_processed_curve(result, yscale=yscale)
result
AnnotatedGrowthCurve(series=0.00     0.000000
0.25     0.100000
0.50     0.200000
0.75     0.300000
1.00     0.400000
1.25     0.500000
1.50     0.600000
1.75     0.700000
2.00     0.800000
2.25     0.900000
2.50     1.000000
2.75     1.051271
3.00     1.105171
3.25     1.161834
3.50     1.221403
3.75     1.284025
4.00     1.349859
4.25     1.419068
4.50     1.491825
4.75     1.568312
5.00     1.648721
5.25     1.733253
5.50     1.822119
5.75     1.915541
6.00     2.013753
6.25     2.117000
6.50     2.225541
6.75     2.339647
7.00     2.459603
7.25     2.585710
7.50     2.718282
7.75     2.857651
8.00     3.004166
8.25     3.158193
8.50     3.320117
8.75     3.320117
9.00     3.320117
9.25     3.320117
9.50     3.320117
9.75     3.320117
10.00    3.320117
10.25    3.320117
10.50    3.320117
10.75    3.320117
dtype: float64, outliers=11.00    3.320117
11.25    3.320117
11.50    3.320117
11.75    3.320117
12.00    3.320117
12.25    3.320117
dtype: float64, growth_phases=[GrowthPhase(start=4.0, end=6.75, slope=np.float64(0.2000000001317033), intercept=np.float64(2.5000000020429036), n0=0.0, SNR=np.float64(2.396726892886494e+18), rank=np.float64(91.5546059379309))])
result = process_curve(curve, constrain_n0=False)
plot_processed_curve(result, yscale=yscale)
result
AnnotatedGrowthCurve(series=0.00     0.000000
0.25     0.100000
0.50     0.200000
0.75     0.300000
1.00     0.400000
1.25     0.500000
1.50     0.600000
1.75     0.700000
2.00     0.800000
2.25     0.900000
2.50     1.000000
2.75     1.051271
3.00     1.105171
3.25     1.161834
3.50     1.221403
3.75     1.284025
4.00     1.349859
4.25     1.419068
4.50     1.491825
4.75     1.568312
5.00     1.648721
5.25     1.733253
5.50     1.822119
5.75     1.915541
6.00     2.013753
6.25     2.117000
6.50     2.225541
6.75     2.339647
7.00     2.459603
7.25     2.585710
7.50     2.718282
7.75     2.857651
8.00     3.004166
8.25     3.158193
8.50     3.320117
8.75     3.320117
9.00     3.320117
9.25     3.320117
9.50     3.320117
9.75     3.320117
10.00    3.320117
10.25    3.320117
10.50    3.320117
10.75    3.320117
dtype: float64, outliers=11.00    3.320117
11.25    3.320117
11.50    3.320117
11.75    3.320117
12.00    3.320117
12.25    3.320117
dtype: float64, growth_phases=[GrowthPhase(start=4.0, end=6.75, slope=np.float64(0.20000000294970724), intercept=np.float64(2.5000001182976948), n0=np.float64(2.6595664825385843e-08), SNR=np.float64(7.975071731849925e+17), rank=np.float64(91.55460698580794))])

The end.